|

Computer Music (MUSC 216)
Principles of Acoustics: What is sound?
SOUND is the consequence of changing air
pressure over time. A more technical definition:
Sound is mechanical energy in the form of pressure variances in an
elastic medium. These pressure variances propagate as waves from a
vibrating source.
Changes in air pressure (air being a propagating medium) can be represented
by a WAVEFORM, which is a graphic representation
of a sound. In reality, sound waves propagate through the air in LONGITITUDAL
WAVES (and not TRANSVERSE WAVES):
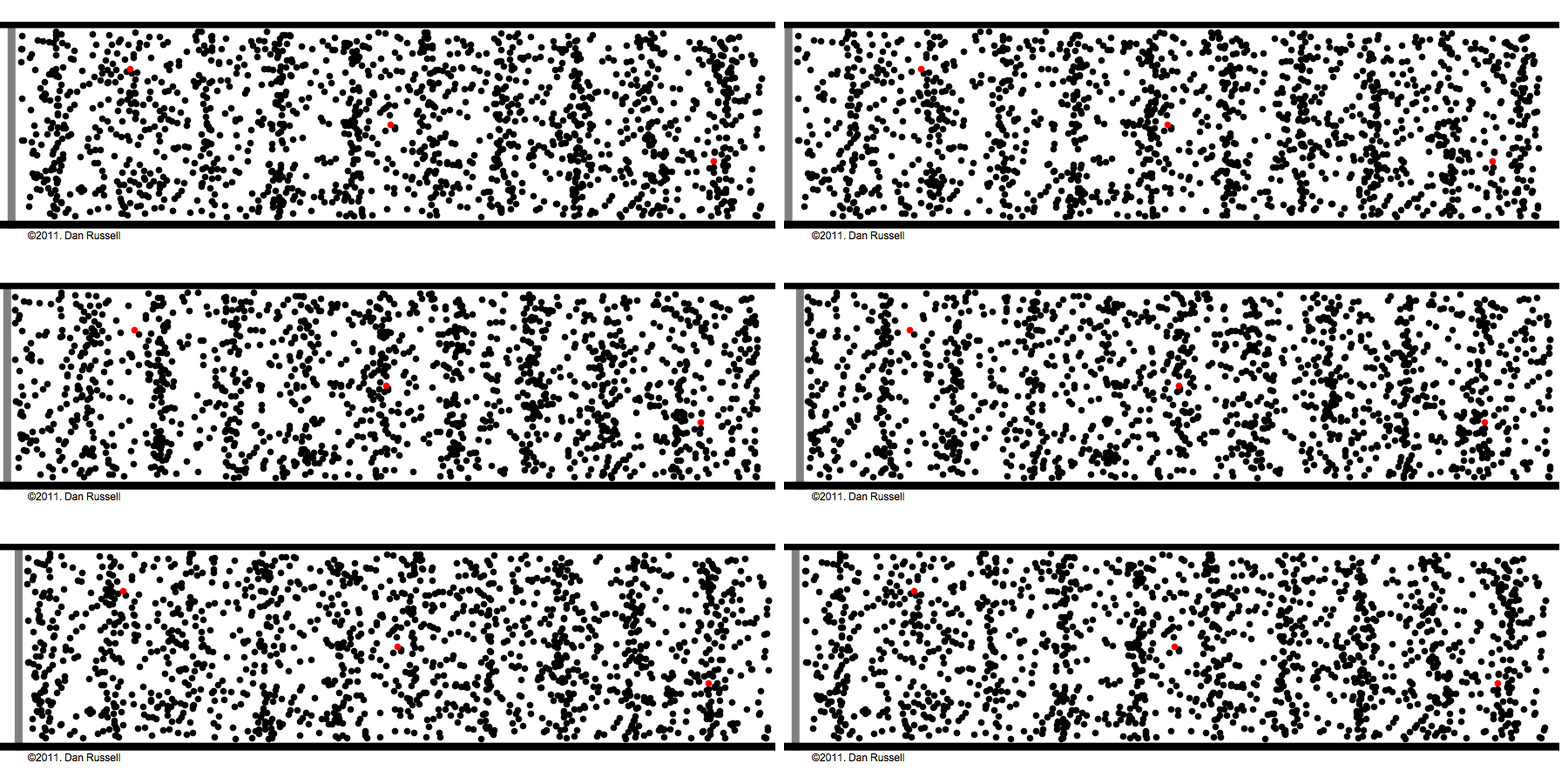
Longitudinal Wave

Transverse Wave
Although sound waves through air are indeed longitudinal, it is more
practical to represent them graphically as TRANSVERSE waves, as in
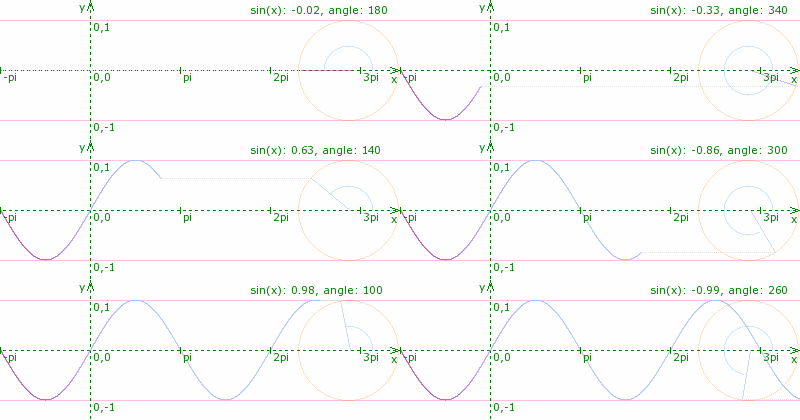
this simple sinusoid (sine wave):
Sine Waves
Sound travels through dry air at approximately 1100 ft. per second
(approx. 760 miles per hour). See Speed
of Sound through Air.
See Acoustics
Animations.
See SOUND
in Barry Truax's Handbook for Acoustic Ecology. Sound consists
of BOTH physical or ACOUSTIC aspects AND psychological or PERCEPTUAL
aspects.
Also see SOUND
from Wikipedia.
See Basic
Acoustics for Electronic Musicians (St. Olaf College).
In representing a sound graphically on paper or digitally on a computer,
it is important to understand the various characteristics of a WAVEFORM.
See Parts
of a Wave to understand: peaks, troughs, amplitude,
cycles per second (cps), Hertz (Hz), positive amplitude,
negative amplitude, wavelength.
ACOUSTICS is the science and study of
sound.
See ACOUSTICS
in Barry Truax's Handbook for Acoustic Ecology. The study of
ACOUSTICS is the study of the PHYSICS OF SOUND.
Also see ACOUSTICS
from Wikipedia.
See the Acoustical
Society of America -- Career Opportunities in Acoustics
See Acoustics
Animations.
AMPLITUDE
The curving line in this diagram (Fig. 1) represents displacement
of whatever medium through which the WAVE is PROPAGATING,
for example, through the air. This corresponds to the energy in the
wave and consequently how loud it appears to be. The energy
of the WAVE is called the AMPLITUDE and this is related
to the PERCEIVED LOUDNESS.

Loud amplitude
Play
Sound

Soft amplitude
Play
Sound
AMPLITUDE can change over time (the sound can get louder or
softer):

Sound getting softer over time
Play
Sound
There are many ways of measuring AMPLITUDE; since
it relates to the size of the pressure variations in the air it can
be measured in units of pressure. More often we talk about deciBels
(dB) which measure amplitude on a logarithmic scale relative
to a standard sound. [A DECIBEL is 1/10th of a BEL, where
one BEL (named after Alexander
Graham Bell) represents the difference in sound level between
two intensities, where one is 10 times greater than the other.] The
dB scale is useful since it maps directly to
the way that humans perceiveloudness. However, PERCEIVED
LOUDNESS is more complicated than just measuring amplitude.
Try this experiment: Using SYD, set up a simple
sine wave patch with a frequency of 1000 Hz and an amplitude of 50%
(.5). Synthesize the patch and then play it. Now change the frequency
to 100 Hz but leave the amplitude the same. Most people would agree
that the patch played at 100 Hz sounds 'softer' than the patch at 1000
Hz even though the amplitudes are the same. Now play the patch again
at 1000 Hz. Change the frequency to 3000 Hz but leave the amplitude
the same. Most people would agree that the patch played at 3000 Hz sounds
'louder' than the patch at 1000 Hz even though the amplitudes are the
same.
In the realm of PSYCHO-ACOUSTICS, perceived loudness
is a function of both frequency AND amplitude (Fletcher-Munson Curves:
the Equal
Loudness Contour). At low intensities tones have the same loudness
when they are equally detectable, whereas at high intensities they match
in loudness when they have the same intensity. See Hearing.
See Intensity. See Loudness.
See Mastering
FAQ; How loud is it?
See AMPLITUDE
in Barry Truax's Handbook for Acoustic Ecology.
Also see AMPLITUDE
from Wikipedia.
See Amplitude
(St. Olaf's College) -- An excellent and easy to understand discussion
of decibels.
See DECIBEL
in in Barry Truax's Handbook for Acoustic Ecology.
See an excellent article on "What
is a DECIBEL?"
CYCLE or PERIOD
CYCLE or PERIOD refers to one repetition of a wave
through 360 degrees:

One CYCLE or PERIOD
See CYCLE
in Barry Truax's Handbook for Acoustic Ecology.
See PERIODICITY
from Wikipedia.
PHASE
PHASE refers to the point in a CYCLE where a wave begins.
For example, here is the same WAVE starting 1/4 the way through a
CYCLE. The PHASE is .25 or 90 degrees.

One CYCLE or PERIOD
See PHASE
in Barry Truax's Handbook for Acoustic Ecology.
See PHASE
from Wikipedia.
FREQUENCY
A PITCHED SOUND is one that has
a repetitive CYCLE or PERIOD. PITCH is determined
by the number of CYCLES per second and is called
FREQUENCY. The term, HERTZ (Hz)
refers to the mathematician, Henrich
Hertz and is used to represent the number of cycles per second.
The RANGE OF AUDIBLE FREQUENCY
FOR THE HUMAN EAR is between approximately 16 Hz and
20,000 Hz (20 kHz). The note 'A' above Middle C (C3) has 440 cycles
per second (Hz). How many Hertz (Hz) is the following sound? Would
this be a low sound or a high sound? Why?

PITCHED SOUND has a repetitive cycle
(period)
Play
Sound

NOISE has no repetetive cycle or period
Play
Sound
Sound with a frequency above the range of human hearing
(20,000 Hz) is called ULTRASONIC. Sound below the range of
human hearing (16 Hz) is called INFRASONIC.
See FREQUENCY
in Barry Truax's Handbook for Acoustic Ecology.
See FREQUENCY
from Wikipedia.
CONSTRUCTIVE and DESTRUCTIVE INTERFERENCE.
The concepts of PHASE and FREQUENCY are particularly
useful for describing the interactions which occur when two sounds
are combined. If two sounds have the same FREQUENCY and have
the same PHASE they are said to be "in PHASE." The resultant
AMPLITUDE is a simple addition of the two respective amplitudes
(they are added together) and produce an overall LOUDER sound.
This phenomenon is called CONSTRUCTIVE INTERFERENCE.
If a sound begins when another sound of the same frequency is half
a CYCLE ahead (180 degrees), then the crests of one wave will
coincide with the troughs of the other. In this case, the two sounds
are described as being 180 degrees "out of PHASE." The
AMPLITUDE of one sound will be subtracted from the AMPLITUDE
of the other sound resulting in a a phenomenon called DESTRUCTIVE
INTERFERENCE. If the amplitudes of the two sounds are equal, then
the two sounds will cancel each other out totally and there
will be no sound (zero amplitude).
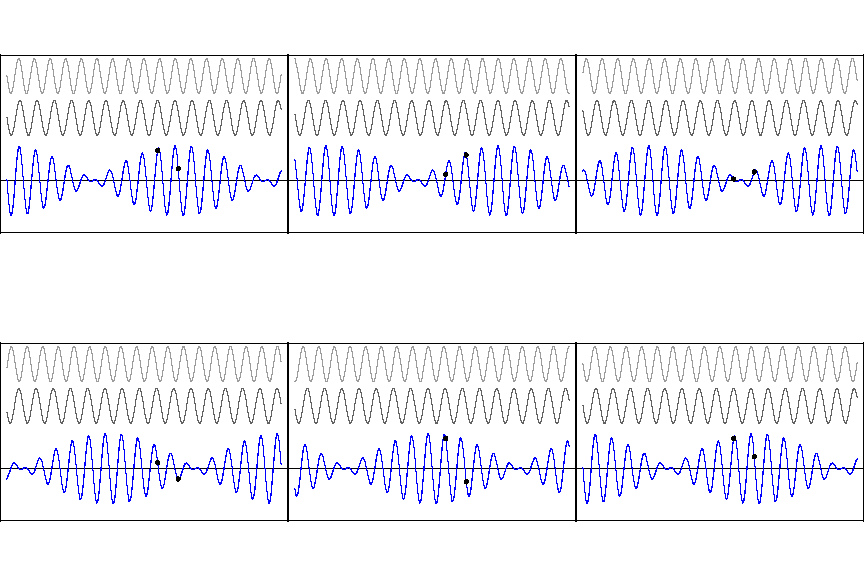
Where the wave peaks and troughs coincide,
their amplitudes are summed: Constructive interference
Where the wave peaks and troughs are in opposition, their amplitudes
are canceled: Destructive interference
See CONSTRUCTIVE
INTERFERENCE.
See DESTRUCTIVE
INTERFERENCE.
See INTERFERENCE
from in Barry Truax's Handbook for Acoustic Ecology.
See INTERFERENCE
from Wikipedia.
HARMONIC SERIES
All naturally produced (non-electronic) pitched sounds (a clearly defined
musical note) have a SPECTRUM consisting of the NATURAL HARMONIC
SERIES. This is "an ordered set of frequencies which are integer
multiples of a FUNDAMENTAL" frequency. For example, if the FUNDAMENTAL
is 100 Hz, then the 2nd harmonic (the 1st "overtone") is 200
HZ, the 3rd harmonic is 300 Hz, etc; if the FUNDAMENTAL is 440 Hz, then
the 2nd harmonic (the 1st "overtone") is 880 HZ, the 3rd harmonic
is 1320 Hz, etc.
In addition, in naturally produced sounds the amplitudes of the various
harmonics in their SPECTRUM is inversely proportional to their position
in the series. For example, if the amplitude of the FUNDAMENTAL is 1/1
(100% or 1.0), then the amplitude of the 2nd harmonic is 1/2 ( 50% or
.5), the amplitude of the 3rd harmonic is 1/3 (33.33% or .33), etc.

Harmonic Series showing frequencies
and amplitudes
See HARMONIC
SERIES in Barry Truax's Handbook for Acoustic Ecology.
See HARMONIC
SERIES (mathematical description) from Wikipedia.
See HARMONIC
SERIES (musical description) from Wikipedia.
SOUND SPECTRUM
The SPECTRUM of a sound is a graphic representation of the HARMONICS
(see Harmonic Series above) or RESONANCE of the sound. All naturally
produced (non-electronic) pitched sounds (a clearly defined musical
note) have a SPECTRUM consisting of the NATURAL HARMONIC SERIES.

3-D Spectrum of a RECORDER showing the
HARMONICS changing over time
See a great article at What
is a Sound Spectrum?
See SPECTRUM
in Barry Truax's Handbook for Acoustic Ecology.
See ACOUSTIC
SPECTRUM
from Wikipedia.
BEATING
When two sounds with a slightly different frequency are combined, the
listener will have the impression that there is a single sound, but
its loudness (amplitude) will pulsate as the contributing sounds (waveforms)
are alternately in phase and out of phase. For example, consider the
combination of a sound with a frequency of 441 Hz and a sound with a
frequency of 440 Hz:


Two sounds with slightly different frequencies
The sounds begin together and then interfere constructively.
After one-half second has elapsed, however, the first sound has vibrated
220.5 times, while the second sound has only vibrated 220 times. The
two sounds are a half-cycle apart, or 180 out of phase. At this point,
they interfere destructively, and the combined loudness is diminished.
By the end of one full second, however, both sounds have completed full
cycles. The 441st cycle for the first sound, the 440th cycle for the
second sound. The two sounds are in phase again, and their combined
loudness is greater. This alternating pattern of constructive and
destructive interference will continue as long as the two sounds
are combined. Once each second the loudness will rise, and then it will
diminish. If the difference between the two frequencies is 2 cycles
per second, then the loudness will rise and diminish twice each second.
This pulsation of loudness, produced by the combination of two sounds
of nearly the same frequency, is called BEATING.


Combined result of two sounds with slightly
different frequencies
The effect of beating is a modulation of
amplitude (the same thing as the volume control of your stereo up and
down at a constant rate). Another name for this AMPLITUDE
MODULATION is TREMOLO.
See BEATS
in Barry Truax's Handbook for Acoustic Ecology.
NOISE
NOISE can be defined in two ways: (1) any unwanted sound (as
in CIPPPING, QUANTIZATION
NOISE, or AILIASING; (2) sound
which has no discernible repetitive wave pattern or period and resembles
the static sometimes heard on a a radio or television. This second
type of NOISE has RANDOM amplitude and frequency. Here is the
waveform for "white noise":

White Noise: random amplitude and frequency
Play
Sound
The 2nd type of NOISE might be referred to as,
"good noise" because it is essential in synthesizing certain
types of sounds. For the purposes of this class, NOISE will
generally refer to the 2nd type and not the 1st type.
Other types of NOISE are PINK NOISE and
BROWN NOISE. See: Noise.
See NOISE
in Barry Truax's Handbook for Acoustic Ecology.
See NOISE
from Wikipedia.
TIMBRE
TIMBRE (pronounced "tam-ber") is the tone quality of a pitched
sound. For example, a piano has a different timbre than a flute. TIMBRE
is determined by (RESONANCE, which
is the combination of frequencies at specific amplitudes within
an individual cycle. For example below are the waveforms of a piano
and a flute:

Piano

Flute
The small changes in AMPLITUDE within the individual
CYCLES of the WAVEFORM are indications of the different
frequencies which color the sound and make it uniquely distinct. This
complex array of FREQUENCIES along with their specific AMPLITUDES
is called the HARMONIC SPECTRUM, or RESONANCE.
See TIMBRE
in Barry Truax's Handbook for Acoustic Ecology.
See TIMBRE
from Wikipedia.
ENVELOPE
Another important aspect of any sound is its ENVELOPE. That
is, its ATTACK, SUSTAIN (also called STATIONARY SOUND)
and DECAY. Attack is the point
in time when the sound begins and is the single most important part
of the sounds for the ear to determine the individuality of the sound.
For example, the attack of a piano waveform is the single most important
part of the sound for the ear to determine that the sound was actually
a piano and not a flute. Sustain is that
part of the sound waveform which maintains a more or less constant
amplitude. Decay is that part of the sound
waveform which begins to decrease in amplitude because of a loss of
energy.
Here is a graphic example of a sound with a distinctive envelope:

Sound with Envelope
Play
Sound
See ENVELOPE
in Barry Truax's Handbook for Acoustic Ecology.
SAMPLE
A digital representation of a sound is called a SAMPLE. Sampling
a sound is a similar process to recording a movie using film (not
video tape). With film, a camera takes 32 frames (pictures) per second
and this is enough information to fool the brain into seeing a continuous
and uninterrupted motion. With sound, the brain needs much more information.
A good SAMPLING RATE is in excess
of 8000 frames (samples) per second, that is 8 kilo-Hertz (8 kHz).
A better sampling rate is 22 kHz. The best sampling rates are in excess
of 44.1 kHz. 44,100 Hz (44.1
kHz) is the standard sampling rate for CD production. At this
sampling rate the extremes of sound frequency from the lowest pitches
to the highest pitches which the ear is physically capable of hearing
can be accurately represented.
Another aspect of sampling is the SAMPLE
RESOLUTION of the sample. That is, how accurately an individual
sample is stored digitally, for example, 8 bit samples, 16 bit samples,
32 bit samples, etc. The higher the bit resolution, the more accurately
the sample is represented digitally. Sixteen bit samples are generally
considered high enough resolution to accurately represent an individual
sound for the human ear.
An important factor which enters into decisions regarding rate and
resolution of sampling is hardware limitations. High sampling rates
combined with high resolution rates require large amounts of memory
and/or disk storage. If hardware capabilities are limited then certain
tradeoffs will have to be considered when deciding on sample rate
and resolution. When a sound is sampled by a computer or sampler (digitizer),
the resulting waveform can be saved as a computer file called a SOUNDFILE.
Some common soundfile formats are AIFF (Audio
Interchange File Format), a standard file format supported by applications
on the Macintosh and Windows computers; µlaw, an 8-bit sound encoding
that offers better dynamic range than standard (linear) 8-bit coding;
WAVE (.WAV), a standard sound format for
the Windows platform; .au, An audio file format that is popular on
Sun and NeXT computers, as well as on the Internet.
See DIGITAL
RECORDING in Barry Truax's Handbook for Acoustic Ecology.
See SAMPLING
(signal processing) from Wikipedia.
See Digital
Sounds and Sampling Rate (St. Olaf's College)
The NYQUIST LIMIT
The mathematician, Harry
Nyquist, proved conclusively that accurate reproduction of
any sound, no matter how complicated, required a sampling rate no
higher than twice as high as the highest frequency that could be heard
(NYQUIST LIMIT). This means that high fidelity requires a sampling
rate of only 30 kHz and even the best of human ears needs only 40
kHz. CD's sample at 44.1 kHz. For example, if a sampling rate of 11.025
kHz was used, then the highest frequency that could be accurately
represented digitally would by only 5.5125 kHz. The highest note on
a piano keyboard is C7 and is 1.9755 kHz (1975.5 Hz). However, the
highest note possible with MIDI is G8 which would be 6.272 kHz (6272
Hz). Consequently this pitch if sampled at only 11.025 would not be
accurately represented and would actually have a different timbre
(waveform). In order to sample a pitch of 6.272 kHz you would need
a sampling rate of 6.272 x 2, or 12.544 kHz. SoundEdit 16 only supports
three sampling rates for the Macintosh computer hardware. Consequently,
you would need to use the sampling rate of 22.050 kHz in order to
accurately record (sample) the pitch G8.
See Digital
Sounds and Sampling Rate (St. Olaf's College)
See NYQUIST
FREQUENCY from Wikipedia.
See NYQUIST-SHANNON
SAMPLING THEOREM from Wikipedia.
See Filter
Basics: Anti-Aliasing for a discussion of the Nyquist Limit,
Aliasing, etc.
See Consequences
of Nyquist Theorem for Acoustic Signals Stored in Digital Format from
Proceedings from Acoustic Week in Canada 1991.
Common Problems with Digitized Sound (unwanted DIGITAL
NOISE):
ALIASING
Frequencies higher than one-half the sampling rate falsely appear
as lower frequencies. This phenomenon is called ALIASING.

Sound with a frequency of 1500 Hz sampled
at 1000 Hz.
Sample points are not enough to accurately represent the wave form
and the resulting frequency is LOWER than the actual sampled frequency.
See Aliasing.
See Aliasing2.
See ALIASING
from Wikipedia.
What is the highest frequency that could be sampled with a sampling
rate of 11.025 kHz?
QUANTIZING NOISE
QUANTIZING (QUANTIZATION
NOISE) occurs when a sound is digitized (sampled). The amplitude
of the sample is restricted to only integer values within a limited
range. For example, an 8-bit sample assigns an integer value between
0 - 255 to represent the amplitude of each of the samples. Quantization
gives the reconstructed waveform a staircase shape, compared with
the original sound's smooth, continuous waveform shape. As the sampling
resolution goes down, the amount of noise due to quantization increases.
With 16-bit samples, the amount of quantization error is barely audible.
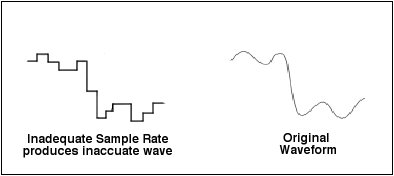
Quantizing Error (noise)
CLIPPING
CLIPPING occurs when the amplitude of a sample exceeds the
quantization range. A clipped waveform appears to be cut off at the
top and bottom, contains more sharp corners, and sounds "rougher"
(is noisier) than the original waveform.
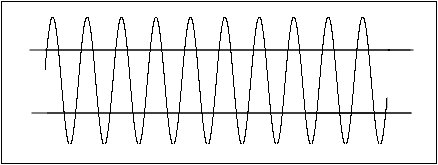
Original Waveform with high amplitude

Clipped waveform resulting from quantization
range not
being high enough to accurately represent the extremes of amplitude.
CLIPPING and QUANTIZATION NOISE can be reduced
or eliminated by:
- reducing the input volume (no RED on the VU Meter).
- using a MIXER for multiple inputs and then adjusting the MIXER's
Master Volume level.
When combining (mixing) individual SOUNDFILES, reduce the output gain
control (if available).
See PEAK
CLIPPING in Barry Truax's Handbook for Acoustic Ecology.
See CLIPPING
from Wikipedia.
Reverberation and Echo
Reverberation is a result of multiple REFLECTIONs. A SOUND WAVE in
an enclosed or semi-enclosed environment will be broken up as it is
bounced back and forth among the reflecting surfaces. Reverberation
is, in effect, a multiplicity of ECHOes whose speed of repetition
is too quick for them to be perceived as separate from one another.
W.C. Sabine established the official period of reverberation as the
time required by a sound in a space to decrease to one-millionth of
its original strength (i.e. for its intensity level to change by -60
dB).
An echo is a repetition or a partial repetition of a sound
due to REFLECTION. REVERBERATION is also reflected sound,
but in this case, separate repetitions of the original sound are not
distinguishable. For a repetition to be distinct from the original,
it must occur at least 50 ms afterwards without being
masked by either the original signal or other sounds. In practice,
an echo is more likely to be audible after a 100 ms delay.
See: PRECEDENCE EFFECT regarding echo suppression.
See REVERBERATION
in Barry Truax's Handbook for Acoustic Ecology.
See ECHO
in Barry Truax's Handbook for Acoustic Ecology.
Be able to define the following terms:
Sound
Waveform
Cycle
Period
Phase
Amplitude
Frequency
Perceived Loudness
Equal Loudness Contour
Decibel (dB)
Bel
Hertz (Hz)
Timbre
Pitched sound
Range of human hearing for high and
low pitched sounds
Spectrum
Harmonic Series
Resonance
Constructive interference
Destructive interference
Beating
Amplitude Modulation
Tremolo
Noise
Envelope
Attack
Sustain
Decay
Sample
Sampling rate
Sample resolution
CD-quality sample rate
Soundfile
AIFF
WAV
Nyquist limit
Aliasing
Quantization noise
Clipping
What is the lowest sampling rate which should be used to sample sounds
with the following frequencies: 20,000 Hz; 16,500 Hz; 26,000 Hz? See
Nyquist limit.
What
is Sound? (from Synth Secrets - a series of articles in Sound
on Sound - A Recording Magazine Online)
Sound
(from the Physics Encyclopedia)
The Wave Theory of Sound
Basic
Acoustics
Acoustics
and Vibrations Animations
Schedule of Classes
Main Page
|


